Case Study: Creating Data Generator
Published:
A custom tool built off of multiple python scripts was created for an in-house UX team to make it easier to create data-heavy prototypes.
Published:
A custom tool built off of multiple python scripts was created for an in-house UX team to make it easier to create data-heavy prototypes.
Published:
In a previous blog post I introduced the concepts of standardization and normalization. A concept common to both of those techniques is distance. Simply put, distance is a mathematical summary of the differences between two objects. These objects can be data points or they can be full distributions. Distance measures fall into two categories:
Published:
UX researchers who deal with quantitative data are familiar with standardization and normalization. The reasons we would apply them in quantitative UX research are similar to why we would apply them in machine learning.
Published:
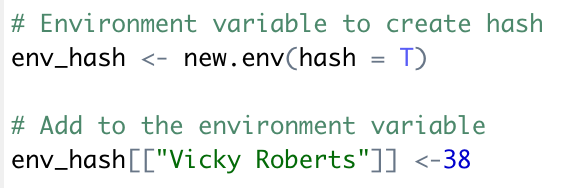
R does not provide a native hash table structure, which is unfortunate because if you need a fast and efficient way to retrieve information without worrying about element order, the hash table is a decent data structure choice. R users are not without options, though. The first option involves using an environment variable. 
Published:
A custom tool built off of multiple python scripts was created for an in-house UX team to make it easier to create data-heavy prototypes.
Published:
R does not provide a native hash table structure, which is unfortunate because if you need a fast and efficient way to retrieve information without worrying about element order, the hash table is a decent data structure choice. R users are not without options, though. The first option involves using an environment variable. 
Published:
In a previous blog post I introduced the concepts of standardization and normalization. A concept common to both of those techniques is distance. Simply put, distance is a mathematical summary of the differences between two objects. These objects can be data points or they can be full distributions. Distance measures fall into two categories:
Published:
UX researchers who deal with quantitative data are familiar with standardization and normalization. The reasons we would apply them in quantitative UX research are similar to why we would apply them in machine learning.
Published:
A custom tool built off of multiple python scripts was created for an in-house UX team to make it easier to create data-heavy prototypes.
Published:
UX researchers who deal with quantitative data are familiar with standardization and normalization. The reasons we would apply them in quantitative UX research are similar to why we would apply them in machine learning.